Will Regional Revitalization Really Increase the Birth Rate?
January 15, 2025
R-2024-058E
Shigeru Ishiba, who became Prime Minister after winning the Liberal Democratic Party presidential election in late September 2024 and the House of Representatives election in late October 2024, was the first Minister of State for Regional Revitalization. While the author also considers the revitalization and sustainability of regional areas important, there is a somewhat concerning trend, namely the growing sentiment among the media and experts suggesting that "correcting the over-concentration [of population and industry] in Tokyo will significantly increase Japan's overall birth rate."
Is this assumption really correct? While the phrase "correcting the over-concentration in Tokyo" existed before regional revitalization began, didn’t it only become linked to birth rates after regional revitalization started? This association can be found in the "Comprehensive Strategy for Revitalizing Towns, People, and Jobs" documents regarding regional revitalization. For example, in Document 4, "On Correcting the Over-concentration in Tokyo," from the "Second Review Meeting on the First Phase of the Comprehensive Strategy for Revitalizing Towns, People, and Jobs," there is a statement that reads, "We have been working to correct the over-concentration in Tokyo because, among other factors, the concentration of young people in the Tokyo metropolitan area, which has maintained a lower birth rate compared to other regions, may lead to population decline for Japan as a whole. Shouldn't we reconsider and build a shared understanding of the significance of correcting the over-concentration in Tokyo in light of recent social and economic changes?" (emphasis added)
While this statement may appear reasonable at first glance, the logical flow of "regional revitalization → correction of the over-concentration in Tokyo → rise in birth rates" is merely a hypothesis. Shouldn't we carefully examine whether correcting the over-concentration in Tokyo will truly increase Japan's overall birth rate? If the validity of this hypothesis proves weak upon examination, we must correct this understanding.
In this context, we should first confirm the fact that Japan's total fertility rate (TFR) has been declining since regional revitalization policies began in 2014. Indeed, while the TFR was 1.45 in 2015, it fell to 1.20 by 2023, and currently, no evidence of regional revitalization positively impacting birth rates can be confirmed.
Nevertheless, new proposals continue to emerge based on the hypothesis of "regional revitalization → correction of the over-concentration in Tokyo → rise in birth rates." A symbolic example would be the report published on April 24, 2024 by the Population Strategy Conference, which is composed of government officials and private sector experts ("Municipality Sustainability Analysis Report" (in Japanese)).
This report defined municipalities like Tokyo, which have low birth rates and rely on population inflow from other regions for their population growth, as "black hole-type municipalities." The impact of this "black hole" terminology led to a public perception, including in the media, that population inflow into such municipalities was problematic in relation to declining birth rates.
The so-called "Tokyo Black Hole Theory" assumes that "Tokyo is causing Japan's overall birth rate to decline," a claim that has been sharply criticized by Nakazato (2024a and 2024b). While Japan's national TFR in 2023 was 1.20 and Tokyo's was 0.99, comparing regional TFRs is not always appropriate, unlike comparisons between countries. Many misunderstandings arise from the characteristics of regional TFR calculation methods. Understanding this issue requires considering multiple perspectives rather than relying on a single indicator. Accordingly, let's clarify several simple facts using the observations made by Nakazato (2024a and 2024b) as one reference.
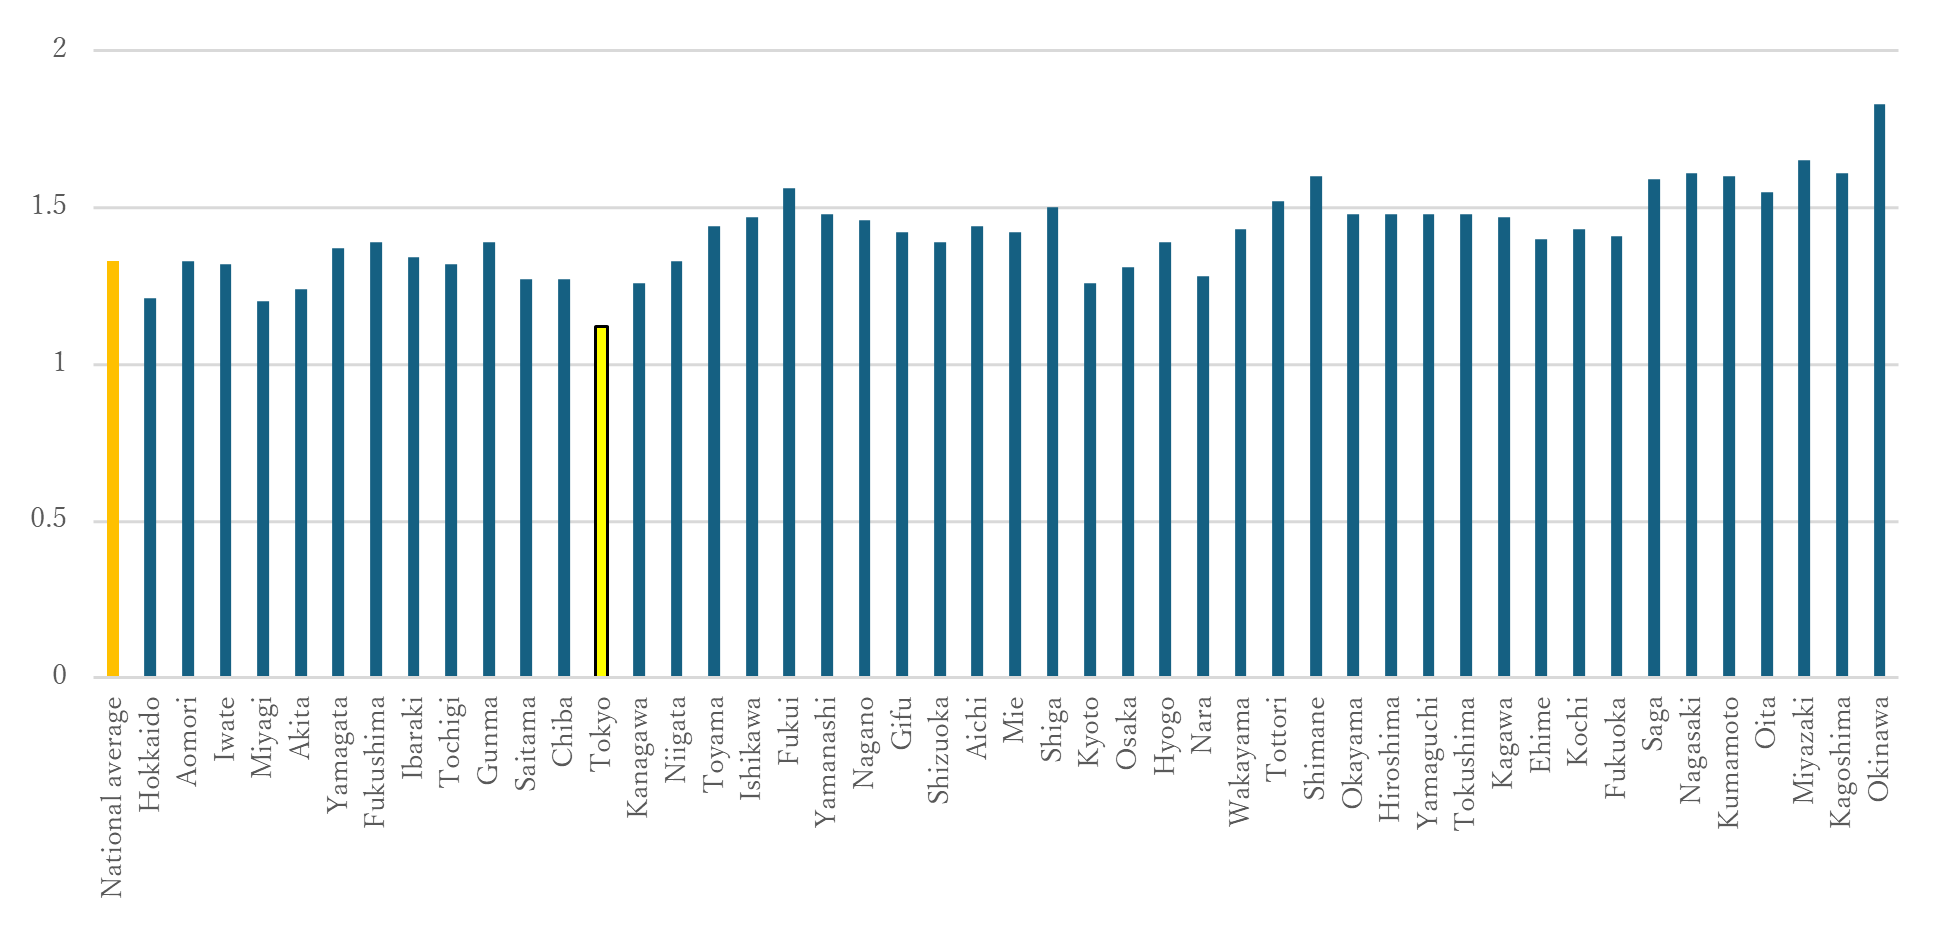
First, Tokyo's TFR indeed ranks the lowest among all prefectures. According to the Ministry of Health, Labour and Welfare's 2023 Vital Statistics (preliminary figures), of the 47 prefectures, Okinawa has the highest TFR at 1.60, whereas Tokyo has the lowest at 0.99. Although the exact figures vary slightly in the 2020 Vital Statistics (final figures), Tokyo still ranked 47th, the lowest position (Table 1). However, other data presents a different picture.
Table 1 Total Fertility Rate (2020)

(Source: Prepared by the author based on the "Overview of Vital Statistics 2020 (Final Figures)" by the Ministry of Health, Labour and Welfare (2022))
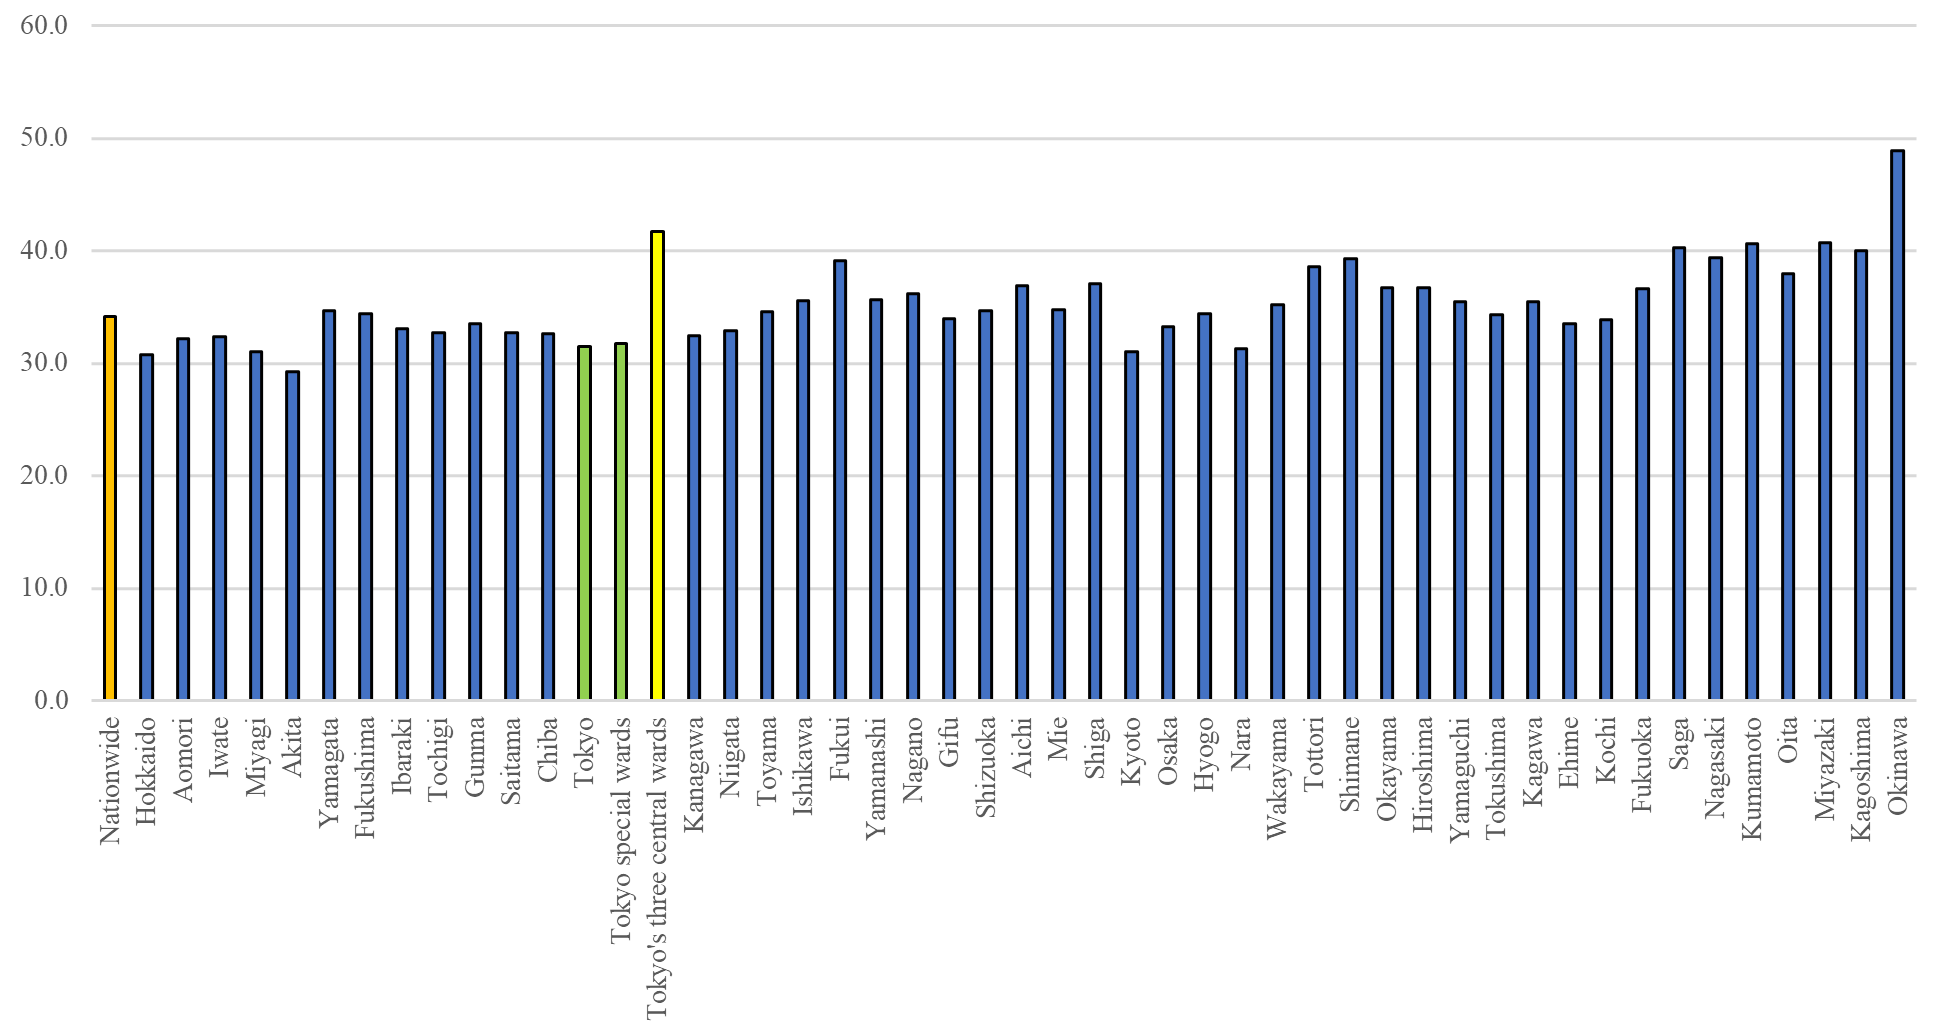
For example, examining the 2020 Census data, when calculating the average birth rate by prefecture (births per 1,000 women of childbearing age, 15–49 years, including unmarried women), Okinawa ranks highest at 48.9, followed by Miyazaki at 40.7, while Tokyo's average birth rate is 31.5, ranking 42nd instead of last.
Similar to Tokyo's position are Iwate (32.4) at 40th, Aomori (32.2) at 41st, and Nara (31.4) at 43rd, followed by Miyagi (31.1), Kyoto (31.0), and Hokkaido (30.8), with Akita (29.3) ranking last (Table 2). More surprisingly, Tokyo's three central wards—Chiyoda, Minato, and Chuo—have an average birth rate of 41.7, which would rank second-highest among the 47 prefectures, just below Okinawa. Among these central wards, Chuo Ward's rate reaches 45.4.
Table 2 Births per 1,000 Women of Childbearing Age (15–49 years)

(Source: Prepared by the author based on the "2020 Census" by the Ministry of Internal Affairs and Communications (2021))
Why do such disparities arise between the total fertility rate (TFR) and the average birth rate (births per 1,000 women of childbearing age, 15–49 years)? The reason lies in how TFR is calculated. Defined as "the average number of children a woman bears in her lifetime," TFR is calculated specifically by summing age-specific fertility rates. This calculation method leads to some peculiar outcomes.
For example, consider a hypothetical scenario involving two regions, each having only women in their 20s and 30s. In Region A, 100 women in their 20s have 30 babies, and 100 women in their 30s have 60 babies. In Region B, 20 women in their 20s have 20 babies, and 80 women in their 30s have 20 babies. While the strict TFR calculation method totals age-specific fertility rates by single years, we will use 10-year increments for simplicity in this discussion. Thus, Region A's age-specific fertility rate for women in their 20s is 0.3 (30 ÷ 100), and for women in their 30s is 0.6 (60 ÷ 100), making Region A's TFR 0.9 (0.3 + 0.6). Similarly, for Region B, the TFR is 1.25 (20 ÷ 20 + 20 ÷ 80), which is higher than that of Region A. However, the average birth rate per woman is 0.45 (90 ÷ 200) in Region A and 0.4 (40 ÷ 100) in Region B, making Region A's rate higher than that of Region B.
Considering such hypothetical examples and comparing rankings by average birth rates alters our perception of Tokyo and its central wards. However, a more peculiar phenomenon arises when population movement occurs between regions. Referencing Amano's (2020) explanation method, let's examine this simple mechanism by first considering a different example involving only Region 1 and Region 2, with the following childbearing populations:
|
Region 1: Women in their 20s: 20 people → 9 women give birth to 9 babies → 9/20 = 0.45 Women in their 30s: 10 people → 8 women give birth to 8 babies → 8/10 = 0.8 Region 2: Women in their 20s: 20 people → 9 women give birth to 9 babies → 9/20 = 0.45 Women in their 30s: 10 people → 8 women give birth to 8 babies → 8/10 = 0.8 |
While actual TFR calculations use single-year age increments, simplifying to 10-year increments here, both regions' TFR is 1.25 (9 babies ÷ 20 women in their 20s + 8 babies ÷ 10 women in their 30s = 0.45 + 0.8). However, if 10 of the 11 women who didn't give birth in Region 1 move to Region 2, even though the number of births remains the same, Region 1's TFR increases while Region 2's decreases:
|
Region 1: Women in their 20s: 10 people → 9 women give birth to 9 babies → 9/10 = 0.9 Women in their 30s: 10 people → 8 women give birth to 8 babies → 8/10 = 0.8 Region 2: Women in their 20s: 30 people → 9 women give birth to 9 babies → 9/30 = 0.3 Women in their 30s: 10 people → 8 women give birth to 8 babies → 8/10 = 0.8 |
Simple calculation confirms that Region 1's TFR becomes 1.7 (9 babies ÷ 10 women in their 20s + 8 babies ÷ 10 women in their 30s) while that of Region 2 becomes 1.1 (9 babies ÷ 30 women in their 20s + 8 babies ÷ 10 women in their 30s), even though the total number of births across both regions remains unchanged at 17. Such apparent decreases in regional TFR due to population movement can, in reality, be observed. For example, this explains why Kyoto City, with its many female university students, and Tokyo's Nerima and Toshima wards have low TFRs. It is fundamentally difficult to assess the ease of childbirth and child-rearing by comparing regional TFRs.
Moreover, the fundamental reason for Japan's low birth rate is that birth rates are low in areas outside of Tokyo as well. This becomes evident when we consider that even if Tokyo's population were to decrease to zero, and assuming TFRs remain constant by region, Japan's national TFR would only increase from 1.20 to 1.23.
This calculation is straightforward. Using recent data from 2022, Japan's total childbearing population (women aged 15–49 years) is 24.14 million, with Tokyo accounting for 2.95 million and the remaining 21.19 million located outside the city. Assuming TFRs remain constant by region, let Z represent the average TFR for regions outside Tokyo. By applying the weighted average of childbearing populations in Tokyo and other regions, we arrive at the following equation: "1.20 (the national TFR) = 0.99 (Tokyo's TFR) × 2.95/24.14 + Z (TFR outside Tokyo) × 21.19/24.14." Solving for Z yields Z = 1.20. This indicates that even if Tokyo's population were reduced to zero, Japan's overall TFR would only rise from 1.20 to 1.23.
While the emphasis on regional TFRs may relate to regional revitalization and political considerations, the belief that correcting the over-concentration in Tokyo will significantly boost Japan's birth rate is merely an illusion. Population dynamics are important factors that significantly affect Japan's economic structure and the medium- to long-term sustainability of its fiscal and social security systems. If we are serious about reversing the declining trend in births to improve this situation, rather than encouraging population competition between municipalities, shouldn't the national government take responsibility and implement measures to directly address the declining birthrate?
References
- Amano, Kanako (2020) "Population Dynamics Data Commentary – Stopping the Acceleration of Declining Birth Rates Due to Misuse of the Total Fertility Rate – Why Inter-Municipal High-Low Evaluation is Taboo" NLI Research Institute Report (September 28, 2020) (in Japanese)
- Nakazato, Toru (2024a) "Is Tokyo a 'Black Hole'? (Part 1): Etcetera on Declining Birth Rates" SYNODOS (in Japanese)
- Nakazato, Toru (2024b) "Is Tokyo a 'Black Hole'? (Part 2): Thinking in Terms of 'Tokyo Nation' and 'Regional Nation'" SYNODOS (in Japanese)


